sasfit4 - fitting up to four peaks for sequences of SANS data
version 1.3 R. Ghosh, ILL, April 2000
Summary
This program uses the fitfun package
to refine the starting parameters for fitting a sequence of diffraction
patterns. A sequence of single runs with the same extension can then be
analysed or runs which have been sectored with several resulting file
extensionnumbers. Simple graphics are incorporated to enable the variation
of derived peak parameters to be viewed and printed.
The program fits up to four peaks, Gaussian, Lorentzian or Voigt
profiles, which allow an interesting peak to be analysed when
it is merging with other unchanging peaks.
Fitting Sequences
There are two methods for fitting data (T or U). In
the first case the trial fit parameters are re-used again and again.
In the second, the previous fit serves as a starting point for the
next in sequence. The first works well when the peak does not move.
The second will follow a peak moving as the sequence evolves
Example of sasfit4
is1 109% sasfit4

 sasfit4   v1.3  April 2000 (Ron Ghosh, ILL)


 Options:
        F          Fit one spectrum (manual fitfun)
                    + other options - plots/cursor etc
        U  i j k l Treat a set of runs i to j
                     and extensions k to l
                   Updating parameters
        T  i j k l Treat a set of runs i to j
                     and extensions k to l
                   (re-use initial fitfun parameters)
        D  j k     Display sequence results
        C          Cursor for next plot (toggle)
        P  j k     PostScript file of seq. plot
        H          for help
        E          Exit
Typically the user must use option F to choose some regrouped data
to examine and trial fit an initial pattern:
At this stage the program enters the fitfuns routines and
a secondary choice of options is offered.
SEQfit option F,C,D,P,T,U, Help or Exit : f
Manual peak fitting and parameter initialisation
Peak type :
1 Single Gaussian
2 Single Lorenztian
3 Voigt - Lorenztian width shown
Width values are half width at half height
Background is value at centre of first peak
Command J for component plots
fit4 version 1.1
TYPE HELP OR OPTION: H,R,D,X,Y,V,F,O,P,L,W,C,E,J,S,T,Z
fit4>h
fit4 Version 1.1 (using FITFUN-6.4) 6-Apr-2000 17:34:18
sasfit4 fitting peaks to diffraction data
PEAK TYPE 1 Single Gaussian
2 Single Lorentzian
3 Voigt - Lorentzian width shown
Width values are half width at half height
Command J for component plots
Basic fitting and control commands
H type this list
R read in fresh data
D display data
X min max change current x-scale to min<x<max
if min and max are 0, show current limits
Y min max change current y-scale to min<y<max etc.
V n v s change parameter number n to v
with associated step s (about 1.0) if
this is to be fitted.
if s is negative parameter n is tied
to preceding parameter #-s
V (no parameters) list current values
F n (N) fit n iterations (0 to show current curve)
N (optional) for no plot while fitting
O a b c d e f only fit spectrum between range of a<x<b
and c<x<d etc. (ignored if both are zero)
P plot fit and data on hardcopy
W flnme write fit and data onto output file flname.fpl
L (F) list last fit (F for full listing)
S save current parameters
C enable/disable cursor(in next plot)
Z clear screen
T extra text set manual title for graphs
J jump to special routine
E EXIT from program.
TYPE HELP OR OPTION: H,R,D,X,Y,V,F,O,P,L,W,C,E,J,S,T,Z
fit4>r
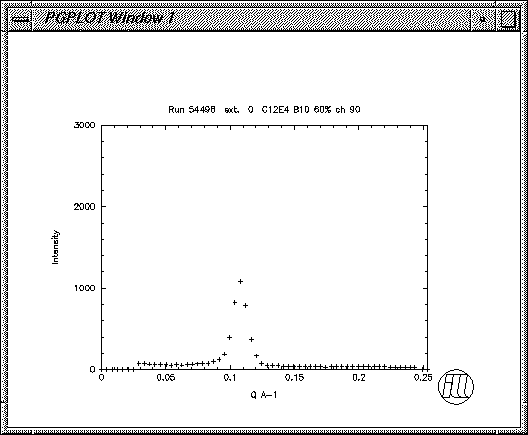
GIVE RUN NUMBER ... EXT : 54498
C12E4 B10 60% ch 90
62 values of I(Q) have been read in.
THERE ARE 21 DATA POINTS IN CURRENT FITTING RANGE
TYPE HELP OR OPTION: H,R,D,X,Y,V,F,O,P,L,W,C,E,J,S,T,Z
fit4>d
 TYPE HELP OR OPTION: H,R,D,X,Y,V,F,O,P,L,W,C,E,J,S,T,Z
fit4>v
FITFUN 6.4 TITLE:Run 54498 ext. 0 C12E4 B10 60% ch 90
FITTING Y : Intensity VERSUS X : Q A-1
NUMBER PARAMETER VALUE ( OLD VALUE ) STEP % DEVIATION
1 FLAT BGD 60.21 ( 60.21 ) 1.000 0.00
2 slope BG -460.6 ( -460.6 ) 5.000 0.00
3 Vgauwdth 0.0000E+00( 0.0000E+00) 0.0000E+00 0.00
4 FACTOR F 0.0000E+00( 0.0000E+00) 0.0000E+00 0.00
5 P1 type 1.000 ( 1.000 ) 0.0000E+00 0.00
6 P1 area 14.39 ( 14.39 ) 1.000 0.00
7 P1 width 0.6912E-02( 0.6912E-02) 1.000 0.00
8 P1 posn 0.1078 ( 0.1078 ) 1.000 0.00
9 P2 type 0.0000E+00( 0.0000E+00) 0.0000E+00 0.00
10 P2 area 0.0000E+00( 0.0000E+00) 0.0000E+00 0.00
11 P2 width 0.0000E+00( 0.0000E+00) 0.0000E+00 0.00
12 P2 posn 0.0000E+00( 0.0000E+00) 0.0000E+00 0.00
13 P3 type 0.0000E+00( 0.0000E+00) 0.0000E+00 0.00
14 P3 area 0.0000E+00( 0.0000E+00) 0.0000E+00 0.00
15 P3 width 0.0000E+00( 0.0000E+00) 0.0000E+00 0.00
16 P3 posn 0.0000E+00( 0.0000E+00) 0.0000E+00 0.00
17 P4 type 0.0000E+00( 0.0000E+00) 0.0000E+00 0.00
18 P4 area 0.0000E+00( 0.0000E+00) 0.0000E+00 0.00
19 P4 width 0.0000E+00( 0.0000E+00) 0.0000E+00 0.00
20 P4 posn 0.0000E+00( 0.0000E+00) 0.0000E+00 0.00
100 MAXIMUM STEP 100.0 300 SUBSTEP 0.01000
200 ACCURACY 0.1000E-01
THERE ARE 21 POINTS IN THE CURRENT RANGE SET BY "ONLY" COMMAND.
CURRENT LIMITS (IF RANGE IS NON-ZERO) ARE :
0.650E-01 TO 0.150 0.000E+00 TO 0.000E+00 0.000E+00 TO 0.000E+00
TYPE HELP OR OPTION: H,R,D,X,Y,V,F,O,P,L,W,C,E,J,S,T,Z
fit4>v 6 10 1
fit4>s
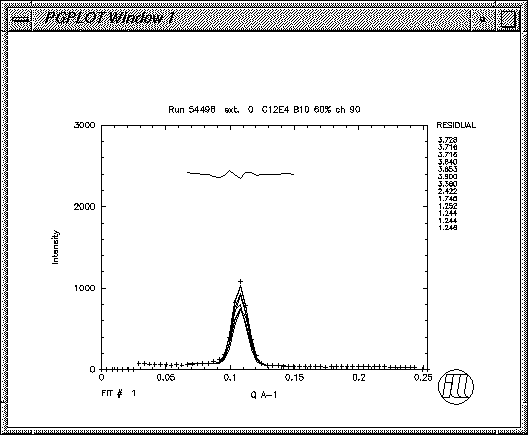
fit4>f 100
TYPE HELP OR OPTION: H,R,D,X,Y,V,F,O,P,L,W,C,E,J,S,T,Z
TYPE HELP OR OPTION: H,R,D,X,Y,V,F,O,P,L,W,C,E,J,S,T,Z
fit4>v
FITFUN 6.4 TITLE:Run 54498 ext. 0 C12E4 B10 60% ch 90
FITTING Y : Intensity VERSUS X : Q A-1
NUMBER PARAMETER VALUE ( OLD VALUE ) STEP % DEVIATION
1 FLAT BGD 60.21 ( 60.21 ) 1.000 0.00
2 slope BG -460.6 ( -460.6 ) 5.000 0.00
3 Vgauwdth 0.0000E+00( 0.0000E+00) 0.0000E+00 0.00
4 FACTOR F 0.0000E+00( 0.0000E+00) 0.0000E+00 0.00
5 P1 type 1.000 ( 1.000 ) 0.0000E+00 0.00
6 P1 area 14.39 ( 14.39 ) 1.000 0.00
7 P1 width 0.6912E-02( 0.6912E-02) 1.000 0.00
8 P1 posn 0.1078 ( 0.1078 ) 1.000 0.00
9 P2 type 0.0000E+00( 0.0000E+00) 0.0000E+00 0.00
10 P2 area 0.0000E+00( 0.0000E+00) 0.0000E+00 0.00
11 P2 width 0.0000E+00( 0.0000E+00) 0.0000E+00 0.00
12 P2 posn 0.0000E+00( 0.0000E+00) 0.0000E+00 0.00
13 P3 type 0.0000E+00( 0.0000E+00) 0.0000E+00 0.00
14 P3 area 0.0000E+00( 0.0000E+00) 0.0000E+00 0.00
15 P3 width 0.0000E+00( 0.0000E+00) 0.0000E+00 0.00
16 P3 posn 0.0000E+00( 0.0000E+00) 0.0000E+00 0.00
17 P4 type 0.0000E+00( 0.0000E+00) 0.0000E+00 0.00
18 P4 area 0.0000E+00( 0.0000E+00) 0.0000E+00 0.00
19 P4 width 0.0000E+00( 0.0000E+00) 0.0000E+00 0.00
20 P4 posn 0.0000E+00( 0.0000E+00) 0.0000E+00 0.00
100 MAXIMUM STEP 100.0 300 SUBSTEP 0.01000
200 ACCURACY 0.1000E-01
THERE ARE 21 POINTS IN THE CURRENT RANGE SET BY "ONLY" COMMAND.
CURRENT LIMITS (IF RANGE IS NON-ZERO) ARE :
0.650E-01 TO 0.150 0.000E+00 TO 0.000E+00 0.000E+00 TO 0.000E+00
TYPE HELP OR OPTION: H,R,D,X,Y,V,F,O,P,L,W,C,E,J,S,T,Z
fit4>v 6 10 1
fit4>s
fit4>f 100
 FITTING.....
.....ENDED
TYPE HELP OR OPTION: H,R,D,X,Y,V,F,O,P,L,W,C,E,J,S,T,Z
Having now obtained a good set of starting parameters for fitting
the sequence this is now performed:
 fit4>e

 SEQfit option F,C,D,P,T,U, Help or Exit : t 54498 54505
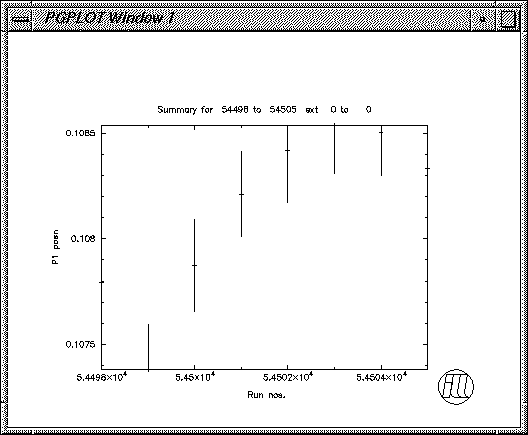
   run    ext  Backgr   %         Area   %    Width  %  Position  %     B-Slope    B-Con.  fit
  54498    0  60.07500  18.7      14.4  2.83 0.0069  2.62 0.10779  0.16 -464.385   60.075  0
  54499    0 108.42580  35.5      36.3  8.18 0.0072  2.09 0.10738  0.20 -613.967  108.426  0
  54500    0 120.86198  47.2      40.8  9.69 0.0072  3.05 0.10787  0.20 -797.150  120.862  0
  54501    0 119.89059  39.1      42.0  9.38 0.0072  2.62 0.10821  0.19 -660.759  119.891  0
  54502    0 113.64807  37.5      41.8  9.09 0.0071  6.88 0.10842  0.23 -613.890  113.648  0
  54503    0 113.38006  35.1      41.4  8.96 0.0071  3.31 0.10854  0.21 -580.074  113.380  0
  54504    0 117.37156  39.6      41.2  9.20 0.0071  3.64 0.10850  0.19 -672.662  117.372  0
  54505    0 118.80327  50.6      40.9 10.22 0.0071  2.68 0.10833  0.25 -788.728  118.803  0
 SEQfit option F,C,D,P,T,U, Help or Exit : d 1 8

 SEQfit option F,C,D,P,T,U, Help or Exit : p 1 8
 SEQfit option F,C,D,P,T,U, Help or Exit : e
 Closing listing file d164709.lis
 Closing listing file d164708.res
 %PGPLOT,  Closing file fit4707.ps
Summary of using fitfun to set up initial parameters
The pattern is read-in using the R command.
The fitfun package offers a D (display option) to view the input data
and cursors/scale settings etc. as well as the ability to trial fit
the data manually, and with a number of automatic iterations.
The current parameters are listed with the V command.
The starting parameters can be modified with the V command
setting an initial non-zero step if the parameter is to be
refined. Normally the step is about unity. This is used as a
local multiplier for the standard step defined in parameter 300
(typically 2%). When the fit appears very sensitive to the
step size then reduce the individual parameter step, say to 0.05.
If the fit appears very insensitive to the step increase the
individual parameter step by a factor of say 20. Do not attempt
to set steps for the parameters which control the type of model
fit!
The current variables can be saved with the S command manually. These
will be reread should the program be interrupted and restarted.
The fit is then started limiting the number of iterations to a maximum
of 100.
When the fit terminates these parameters can be transferred to the
sequence treatment by exiting E from this manual phase.
The results are stored temporarily.
Fitting a sequence of SANS regrouped data files
The principal
program options now reappear and a sequence of runs and subpatterns
may then be treated with the T or U command depending on
whether the starting parameters are to be reinitialised or not.
The program will treat ascending or descending series, to allow the best,
but disappearing, peaks to be used to set the initial search state. When fitting
becomes progressively more difficult certain parameters, notably the
position, should be held fixed (step 0.0) which will limit the program
from diverging when the peak is really difficult to resolve distinctly.
The D command allows any of the fitted parameters to be plotted
as a function of run number (D 1 n or extension number
D 2 n. A hardcopy PostScript plot is generated using the
P command similarly.
The program produces a listing file of the summary, and the plot file
is a PostScript plot. For spread-sheet use a summary file of twenty
columns is produced including data on backgrounds. The flat background
value is set at the center of the first peak (parameter 8).
The final column contains a fit result. Usually this is 0, indicating that
a minimum has been found without any problems. When set to 1 the
final fit may not be the absolute minimum because the step sizes
are typically too small for peak areas, or too large for positions.
The manual fitfun option F can be used to modify this, or to examine
the fit for any individual component, by opening that data file
O, going back into fitfun F,
and selecting the subspectrum in doubt, and reperforming the fit.
Environment Variables used by the program
sasfit4 uses environment variables to avoid repitition of questions
concerning which type of graphics to use etc.
Typical commands to set up this environment are:
setenv PGPLOT_DIR /usr/ill/lib
setenv PGPLOT_ILL_DEV_1 /xserv
setenv PGPLOT_ILL_DEV_2 /VCPS
setenv PGPLOT_ILL_PPAGE 2
These control the graphical output.
Feedback on these programs will be welcomed by the author,
Ron Ghosh, reghosh (at) gmail.com
 TYPE HELP OR OPTION: H,R,D,X,Y,V,F,O,P,L,W,C,E,J,S,T,Z
fit4>v
FITFUN 6.4 TITLE:Run 54498 ext. 0 C12E4 B10 60% ch 90
FITTING Y : Intensity VERSUS X : Q A-1
NUMBER PARAMETER VALUE ( OLD VALUE ) STEP % DEVIATION
1 FLAT BGD 60.21 ( 60.21 ) 1.000 0.00
2 slope BG -460.6 ( -460.6 ) 5.000 0.00
3 Vgauwdth 0.0000E+00( 0.0000E+00) 0.0000E+00 0.00
4 FACTOR F 0.0000E+00( 0.0000E+00) 0.0000E+00 0.00
5 P1 type 1.000 ( 1.000 ) 0.0000E+00 0.00
6 P1 area 14.39 ( 14.39 ) 1.000 0.00
7 P1 width 0.6912E-02( 0.6912E-02) 1.000 0.00
8 P1 posn 0.1078 ( 0.1078 ) 1.000 0.00
9 P2 type 0.0000E+00( 0.0000E+00) 0.0000E+00 0.00
10 P2 area 0.0000E+00( 0.0000E+00) 0.0000E+00 0.00
11 P2 width 0.0000E+00( 0.0000E+00) 0.0000E+00 0.00
12 P2 posn 0.0000E+00( 0.0000E+00) 0.0000E+00 0.00
13 P3 type 0.0000E+00( 0.0000E+00) 0.0000E+00 0.00
14 P3 area 0.0000E+00( 0.0000E+00) 0.0000E+00 0.00
15 P3 width 0.0000E+00( 0.0000E+00) 0.0000E+00 0.00
16 P3 posn 0.0000E+00( 0.0000E+00) 0.0000E+00 0.00
17 P4 type 0.0000E+00( 0.0000E+00) 0.0000E+00 0.00
18 P4 area 0.0000E+00( 0.0000E+00) 0.0000E+00 0.00
19 P4 width 0.0000E+00( 0.0000E+00) 0.0000E+00 0.00
20 P4 posn 0.0000E+00( 0.0000E+00) 0.0000E+00 0.00
100 MAXIMUM STEP 100.0 300 SUBSTEP 0.01000
200 ACCURACY 0.1000E-01
THERE ARE 21 POINTS IN THE CURRENT RANGE SET BY "ONLY" COMMAND.
CURRENT LIMITS (IF RANGE IS NON-ZERO) ARE :
0.650E-01 TO 0.150 0.000E+00 TO 0.000E+00 0.000E+00 TO 0.000E+00
TYPE HELP OR OPTION: H,R,D,X,Y,V,F,O,P,L,W,C,E,J,S,T,Z
fit4>v 6 10 1
fit4>s
fit4>f 100
TYPE HELP OR OPTION: H,R,D,X,Y,V,F,O,P,L,W,C,E,J,S,T,Z
TYPE HELP OR OPTION: H,R,D,X,Y,V,F,O,P,L,W,C,E,J,S,T,Z
fit4>v
FITFUN 6.4 TITLE:Run 54498 ext. 0 C12E4 B10 60% ch 90
FITTING Y : Intensity VERSUS X : Q A-1
NUMBER PARAMETER VALUE ( OLD VALUE ) STEP % DEVIATION
1 FLAT BGD 60.21 ( 60.21 ) 1.000 0.00
2 slope BG -460.6 ( -460.6 ) 5.000 0.00
3 Vgauwdth 0.0000E+00( 0.0000E+00) 0.0000E+00 0.00
4 FACTOR F 0.0000E+00( 0.0000E+00) 0.0000E+00 0.00
5 P1 type 1.000 ( 1.000 ) 0.0000E+00 0.00
6 P1 area 14.39 ( 14.39 ) 1.000 0.00
7 P1 width 0.6912E-02( 0.6912E-02) 1.000 0.00
8 P1 posn 0.1078 ( 0.1078 ) 1.000 0.00
9 P2 type 0.0000E+00( 0.0000E+00) 0.0000E+00 0.00
10 P2 area 0.0000E+00( 0.0000E+00) 0.0000E+00 0.00
11 P2 width 0.0000E+00( 0.0000E+00) 0.0000E+00 0.00
12 P2 posn 0.0000E+00( 0.0000E+00) 0.0000E+00 0.00
13 P3 type 0.0000E+00( 0.0000E+00) 0.0000E+00 0.00
14 P3 area 0.0000E+00( 0.0000E+00) 0.0000E+00 0.00
15 P3 width 0.0000E+00( 0.0000E+00) 0.0000E+00 0.00
16 P3 posn 0.0000E+00( 0.0000E+00) 0.0000E+00 0.00
17 P4 type 0.0000E+00( 0.0000E+00) 0.0000E+00 0.00
18 P4 area 0.0000E+00( 0.0000E+00) 0.0000E+00 0.00
19 P4 width 0.0000E+00( 0.0000E+00) 0.0000E+00 0.00
20 P4 posn 0.0000E+00( 0.0000E+00) 0.0000E+00 0.00
100 MAXIMUM STEP 100.0 300 SUBSTEP 0.01000
200 ACCURACY 0.1000E-01
THERE ARE 21 POINTS IN THE CURRENT RANGE SET BY "ONLY" COMMAND.
CURRENT LIMITS (IF RANGE IS NON-ZERO) ARE :
0.650E-01 TO 0.150 0.000E+00 TO 0.000E+00 0.000E+00 TO 0.000E+00
TYPE HELP OR OPTION: H,R,D,X,Y,V,F,O,P,L,W,C,E,J,S,T,Z
fit4>v 6 10 1
fit4>s
fit4>f 100
 FITTING.....
.....ENDED
TYPE HELP OR OPTION: H,R,D,X,Y,V,F,O,P,L,W,C,E,J,S,T,Z
 SEQfit option F,C,D,P,T,U, Help or Exit : p 1 8
SEQfit option F,C,D,P,T,U, Help or Exit : e
Closing listing file d164709.lis
Closing listing file d164708.res
%PGPLOT, Closing file fit4707.ps