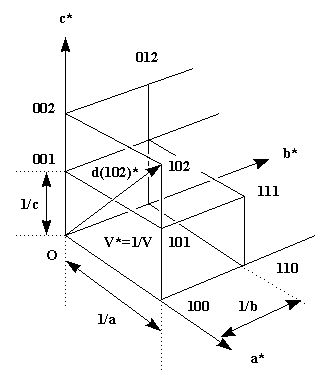
In the introduction to crystal symmetry I have shown that a crystal consists of a periodic arrangement of the unit cell (filled with the motif and its symmetry generated equivalents), into a lattice. In the same fashion we can define the reciprocal lattice, whose lattice dimensions are reciprocal to the original cell (and correspond to the reflection positions) and whose 'size' (the intensity of the reflection) corresponds to the contents of the unit cell. The following picture will make this clear.

Each of the lattice points corresponds to the diffraction from a periodic set of specific crystal lattice planes defined by the index triple hkl. The dimensions of the reciprocal lattice are reciprocally related to the real lattice. In the case of the orthorhombic system I have drawn, the relations are simple: c* = 1/c etc., but in a generic oblique system the relation is more complicated. The length of a reciprocal lattice vector d(hkl)* (from origin to reciprocal lattice point h,k,l) again corresponds to the reciprocal distance d(hkl)of the crystal lattice planes with this index. In our simple case, for 001 this is just the cell dimension c for d(001) or 1/2 c for 002 etc.(d(001)*=1/c, thus d=c).
Exercise 1: show that in
the orthorhombic case the generic
equation for d reduces to
d(hkl) = 1/sqrt((h/a)2 + (k/b)2 +
(l/c)2). Eeeeek, math!
Exercise 2 : The following program calculates reciprocal cell parameters for a given cell, transformation matrices and the d-spacing of a specified reflection.
Run the program with default values.
Notice the simple relation between the direct and the reciprocal lattice in the orthonormal case. Make beta now larger than 90 deg (monoclinic). What happens to the reciprocal cell constants? Why is b* the only one still having the simple relationship b* = 1/b ? (Hint : look at the formula). Also notice that for the same reason d(001) is not equal to 1/c any more.
Set beta back to default value of 90.0.
Look at the 4 matrices listed in the printout. The first
is the cell's metric tensor,
used for fast coordinate system independent calculation
of d between atoms in the cell (the SEXIE program was
initially designed to do just that). It should be easy to
figure out what its components are.
Application of the reduced
orthogonalization matrix transforms
fractional coordinates into orthonormal fractional
coordinates. It is of course unity for a orthonormal
system. The
orthogonalization
matrix to the lower left is expanded with the
unit cell dimensions, and transforms fractional
coordinates into orthonormal Cartesian coordinates in
units of Angstrom, which are what is listed in a pdb file
(Cartesian coordinates are convenient to use in
visualization programs, because no cell information is
needed to draw the molecule). The
deorthogonalization
matrix does exactly the opposite : it
transforms Cartesian in to fractional coordinates. It is
listed in the SCALE records in the pdb files. In oblique
systems the coordinates must be transformed into the
crystallographic (fractional coordinate) reference system
before any symmetry operators can be applied to a
molecule!
Change back to an oblique system and check how the transformation matrices change.
PROGRAM
The vector d(hkl) also determines the location of the diffraction spot in the diffraction image. The diffraction angle at which we observe the reflection is given by Bragg's formula sin(theta)=lambda/2d. The higher the index of a reciprocal lattice point, the larger the diffraction angle will be. We have already seen that the larger the diffraction angle, the higher the resolution, i.e. the finer the detail we can observe in the reconstruction of the crystal structure. This can be easily understood now : we need to 'slice' the crystal fine enough (i.e, small d(hkl) = high indices hkl) to have enough information contained in our diffraction pattern to reconstruct details. In a similar way we needed to make the FT grid (slices) fine enough to resolve details in the Fourier synthesis. A Fourier map from atomic resolution data still looks bad when you use too coarse a FT grid.
In the next chapter we will use the reciprocal lattice and the Ewald construction to visualize some important concepts in data collection.
![]() Back to X-ray Tutorial Introduction
Back to X-ray Tutorial Introduction
LLNL Disclaimer
This World Wide Web site conceived and maintained by
Bernhard Rupp (br@llnl.gov)
Last revised March 02, 2002 14:41
UCRL-MI-125269