Results of PGPLOT examples 3
There are 7 examples here showing various types of contour plots. You can
either scroll down them in numerical order or click on the number in the
next line to go to the one you want.
3.1, 3.2, 3.3,
3.4, 3.5, 3.6,
3.7
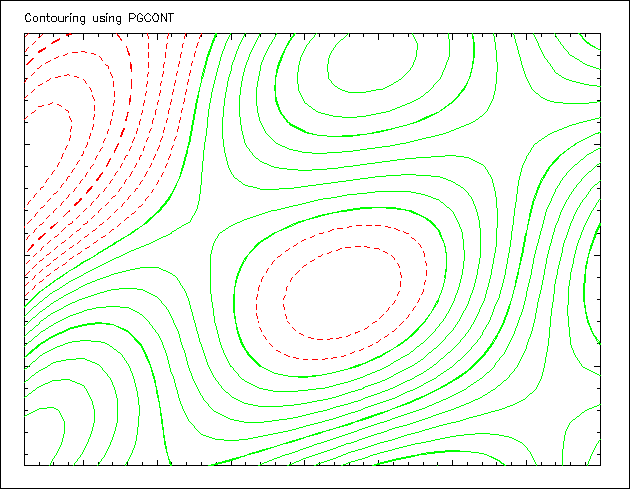
- Example 3-1 Demonstration of contouring routine PGCONT using a 2-D Cartesian data array.
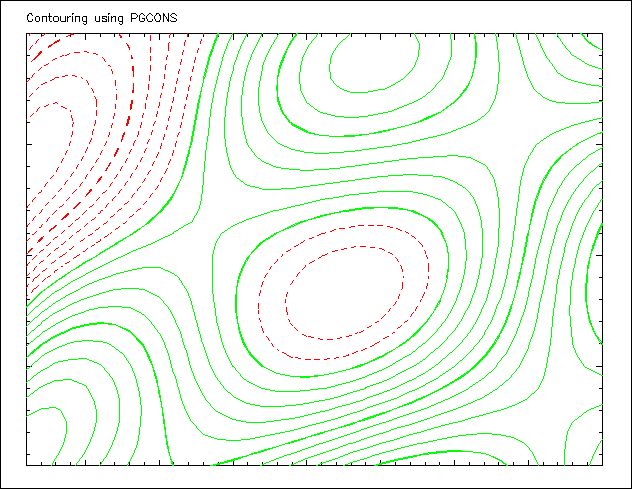
- Example 3-2 Demonstration of fast contouring routine PGCONS; this
routine may be unsuitable for plotting dotted or dashed lines and does not
work for pen plotters.
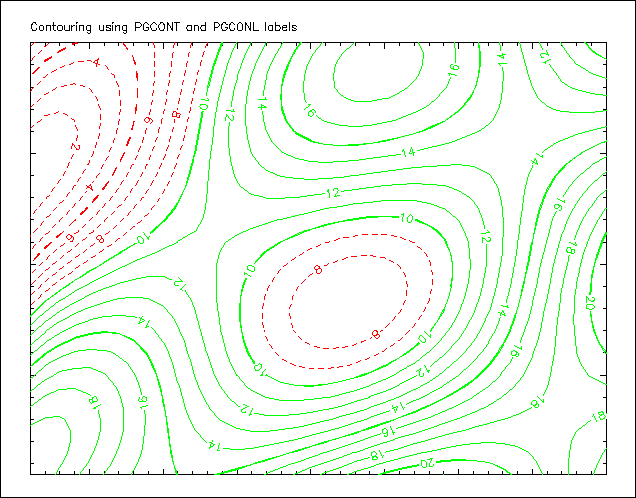
- Example 3-3 Demonstration of contouring routine PGCONT
with labels inserted on the contours by PGCONL.
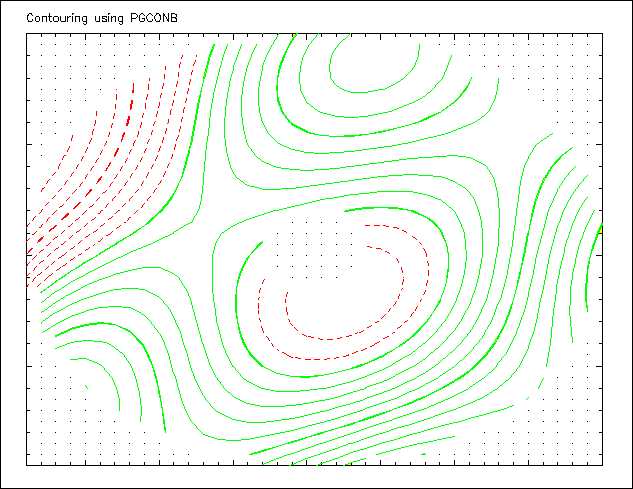
- Example 3-4 Demonstration of contouring routine PGCONB (like PGCONS
but with some areas blanked out).
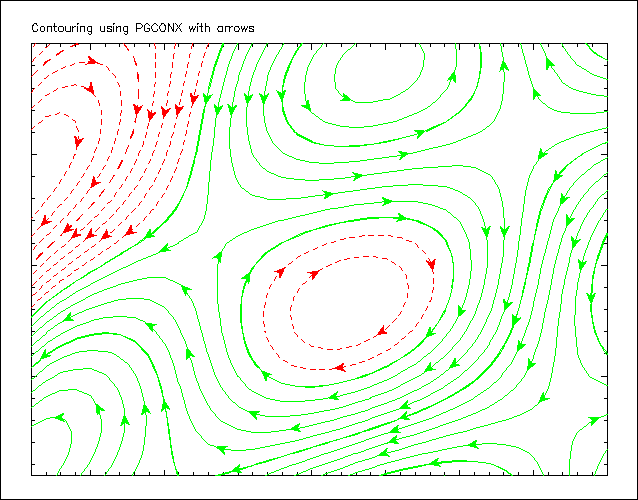
- Example 3-5 Demonstration of contouring routine PGCONX with arrow
labels. PGCONX can work in a non-Cartesian system as shown in the next
example, 3-6.
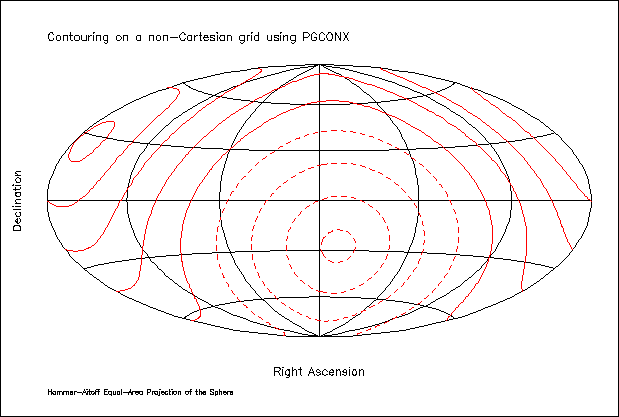
- Example 3-6 Demonstration of contouring on a non-Cartesian grid using
routine PGCONX.
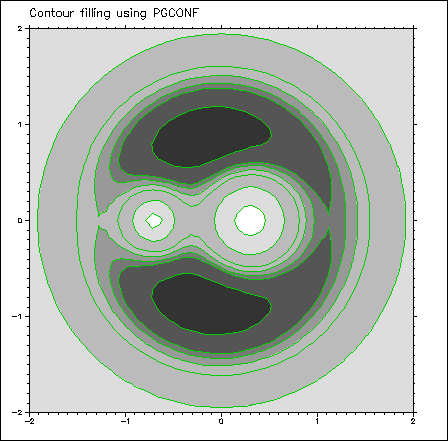
- Example 3-7 Demonstration of contouring routine PGCONF which shades
the areas between contours.
Page last updated 14 Feb 1999
Use your 'back' icon to return to the previous page or
click here to return to the 'Fortran Friends' home page.


