Results of PGPLOT examples 2
There are 6 examples in this demo; they show the various elements that can
be used to make plots and pictures from PGPLOT. You can either scroll down
them in numerical order or click on the number in the next line to go to
the one you want.
2.1, 2.2, 2.3,
2.4, 2.5, 2.6
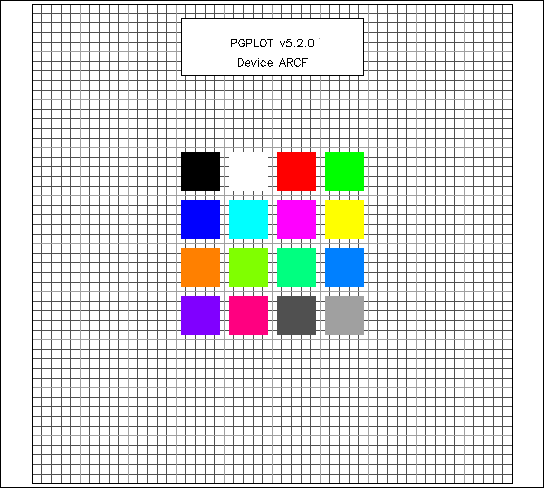
- Example 2-1 is an alignment test: clear the screen, and draw a box and
grid using three monochrome intensities (colour indices 1, 14, and 15). The
plot uses the largest available square viewport and and unit window and
draws square blocks of the 16 standard colours.
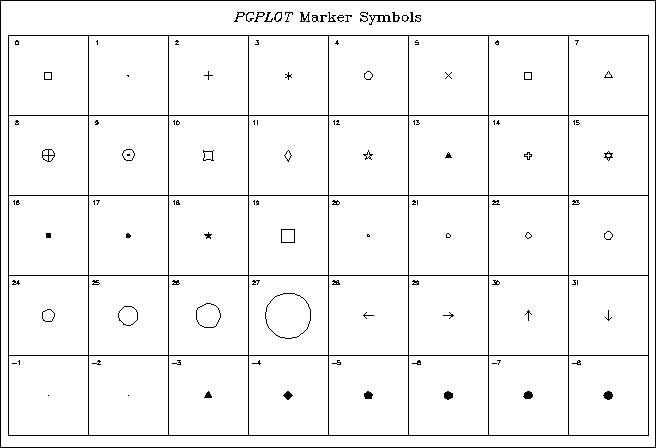
- Example 2-2 shows all the possible marker symbols in a square grid
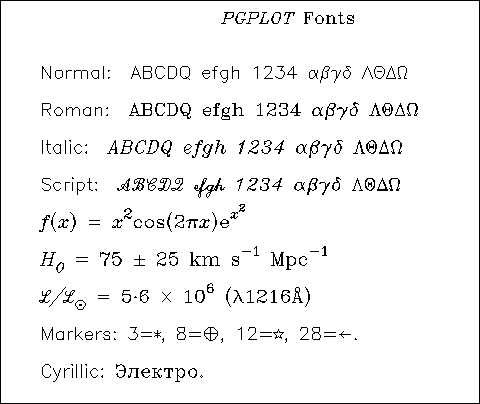
- Example 2-3 shows the text fonts available,
these are similar to the Hershey symbols
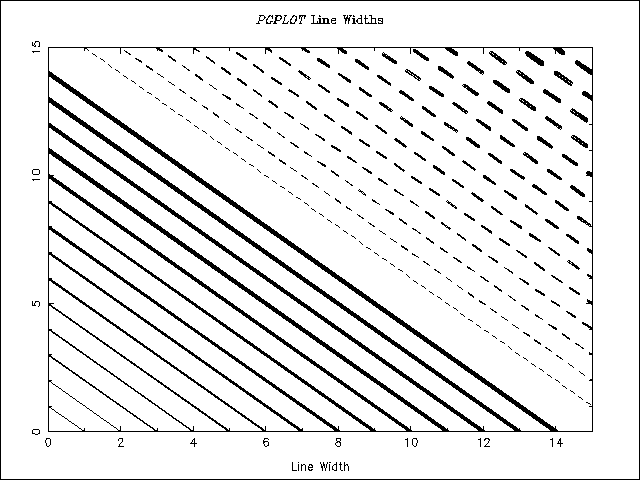
- Example 2-4 shows the various line types and widths
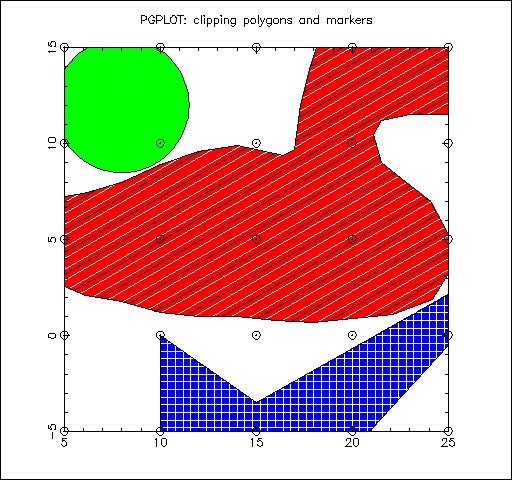
- Example 2-5 shows polygon clipping on polygons and circles, and tests
that markers are clipped correctly. Note that markers exactly on the edge of
the window are supposed to be visible.
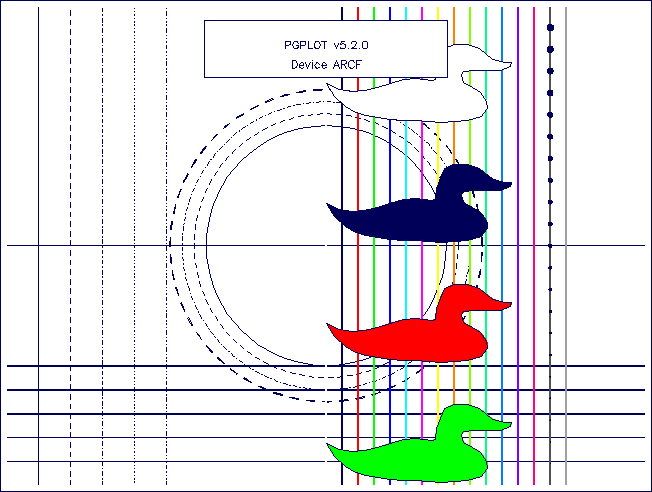
- Example 2-6 is a demonstration of many of the line types, shapes,
clipping and markers.
Page last updated 14 Feb 1999
Use your 'back' icon to return to the previous page or
click here to return to the 'Fortran Friends' home page.


